 |
Technically Precious With Merv
For week ending 10 December 2010
SHORT TERM
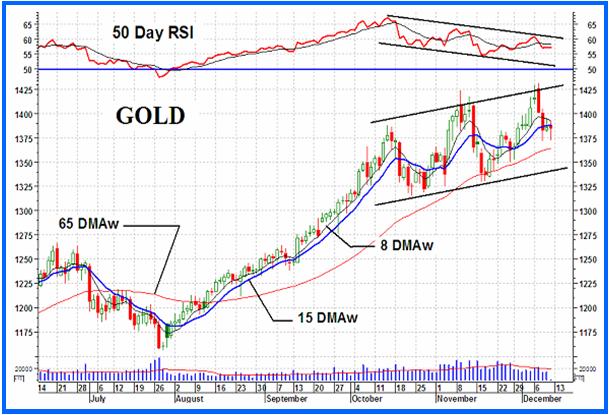
Shown on the chart one can clearly see the negative divergence action of the momentum indicator versus the price action. Shown is my intermediate term momentum indicator. The short term indicator shows the same divergence action (as does the long term momentum) but the action is more volatile. This intermediate term momentum gives a very clear picture.
Now, as for that potential head and shoulder pattern. At the potential right shoulder we now have the price action closing above the highest close at the head and also the intra-day high moving above the highest intra-day high of the head. So, one can say that the potential head and shoulder has been nullified and is no more. However, we do have another pattern just as powerful. We have an upward sloping channel in the price activity and a downward sloping action in the momentum activity. Should the price now move towards the lower support line (former H&S neckline) and break below it that would be just as significant a move as if we still had a H&S pattern break. BUT will the price move to the lower support and break below? That is the question. The price and momentum action could remain in their respective channels for some time, however, they will break out at some point. I expect that break to be to the down side but would not place any money on it at this time, it could go either way. A break to the up side, however, would most likely indicate an explosive move in progress. What would set that off? Who knows?
Getting back to the real world the short term indicators are mixed. The price closed below its short term moving average line and the line slope, although turning towards the down side, is still very, very slightly positive. The short term momentum indicator is toying with the negative zone but remains slightly in the positive. It is, however, below its negative sloping trigger line. As for the daily volume action, that suggests weakness as the daily volume has consistently been below a 15 day average volume throughout most of the recent advance. The short term rating is weakening but has not gone to a full bear. The rating on Friday close is at a - NEUTRAL level. The very short term moving average line is closing in on the short term line but is still slightly above the short term average. This confirms that the rating has not yet gone full bear but is in the process.
As for the immediate direction of least resistance, I'll go with the down side. The very short term moving average line is sloping lower and the Stochastic Oscillator (SO) (not shown this week) is still in a downward phase. The SO may be in a very early phase of turning back to the up side so maybe the downside will be short lived.
| จากคุณ |
:
ฮะ ว่าไงนะ 
|
| เขียนเมื่อ |
:
14 ธ.ค. 53 06:31:32
|
|
|
|
 |






 สวัสดีครับพี่ปรัชญา




 มาแล้ว


