 |
สมาชิกชมรม ~ 300 ท่านเต็มจำนวนแล้ว
-ที่นำมาบอกกล่าวก็เพื่อเป็นกรณีศึกษา ว่าการจะทำอะไร หรือการจะเป็นนักลงทุน ควรต้องลงทุน ศึกษาหาความรู้ก่อน...
-เกือบเดือน ถ้านำมารวมอบรม ติดกันทุกวัน ทุกท่านต้องลงทุนทุกอย่าง เงิน เวลา...อื่นๆ อีกพอสมควรนั่นคือ สิ่งที่เป็นความตั้งใจจริงที่ เราๆท่านๆ ทุกคนควรจะมีมาตั้งแต่ต้น
-นำเฉพาะที่ เกี่ยวกับวิชาเทคนิค ก็แล้วกันว่ามีเรียนอบรมอะไร กันบ้าง
1. Introduction to Investment
1.1. เกริ่น 5 Asset Classes
2. Investment approaches
2.1. Fundamental
2.2. Technical
2.3. อื่นๆ เช่น seasonality, lunar and solar phenomena, cycles and rhythms, neural networks (ตัวอย่างจากหนังสือ The Encyclopedia of Trading Strategies)
2.4. Compare & contrast (เฉพาะระหว่าง fundamental & technical)
3. Trading Style
3.1. Trend following
-3.1.1. Swing trader
-3.1.2. Position trader
-3.1.3. Day trader
3.2. Counter trend, mean reversion
3.3. Scalping
4. Introduction to Technical Analysis (TA คืออะไร + ประวัติความเป็นมา)
5. Dow Theory (principles of TA)
1. Components of Technical Analysis
1.1. Methods of Charting
-1.1.1. Type & Construction
--1.1.1.1. Line chart
--1.1.1.2. Bar chart
--1.1.1.3. Candlestick chart(เฉพาะการอ่าน open-high-low-close)
--1.1.1.4. Point and Figure chart
--1.1.1.5. Chart แบบอื่นๆ (แนะนำคร่าวๆ) เช่น Candle Volume, Equivolume, Kagi, Renko, ThreeLineBreak
-1.1.2. ข้อดีและเสียของ Chart แบบต่างๆ
-1.1.3. Arithmetic VS Logarithmic Scales
-1.1.4. Time Frame - Daily, Monthly, Yearly,
1.2. Support & Resistance
-1.2.1. Psychology of Support & Resistance
-1.2.2. Support Becomes Resistance
-1.2.3. Resistance Becomes Support
1. Trendlines & Channels
1.1. Trendlines
-1.1.1. How to draw correct short, medium and long-term trendlines
-1.1.2. Return lines, Speed lines and Internal trendlines
-1.1.3. Bullish Reversal - Resistance Trendline Becomes Support Trendline
-1.1.4. Bearish Reversal - Support Trendline Becomes Resistance Trendline
-1.1.5. Accelerating & Steepness of Trendlines
1.2. Channels
-1.2.1. Trend (Price) Channels
-1.2.2. Linear Regression Channel
-1.2.3. Standard Error Channel (SEC)
-1.2.4. Channel Breakout (ดูว่าการ Breakout เป็นจริงหรือหลอก โดยดูจากความกว้าง, ความชัน และระยะเวลาของ Channel)
1. Price Patterns
1.1. Reversal Patterns
-1.1.1. Head & Shoulders
-1.1.2. Inverse Head & Shoulders
-1.1.3. Complex Head & Shoulders
-1.1.4. Double Tops & Bottoms
-1.1.5. Triple Tops & Bottoms
-1.1.6. Spike Tops & Bottoms
-1.1.7. Rounding (Saucer) Patterns
-1.1.8. Broadening Top (Fail Pattern)
-1.1.9. Diamond Top Reversal
-1.1.10. Island Reversal
1.2. Continuation Patterns
-1.2.1. Triangles
--1.2.1.1. Symmetrical Triangle
--1.2.1.2. Ascending Triangle (Bullish)
--1.2.1.3. Descending Triangle (Bearish)
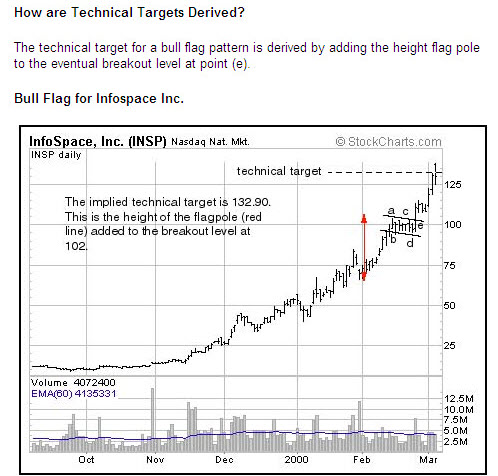
-1.2.2. Flags
-1.2.3. Pennants
-1.2.4. Wedges
-1.2.5. Rectangles
-1.2.6. Cup With Handle (Bullish)
1.3. Consolidation
-1.3.1. Breakout & Confirmation
1.4. How to Identify & Anticipate These Patterns (การใช้ประโยชน์จาก patterns ต่างๆ)
1. Candlestick patterns
2. Gaps
2.1. Common Gap
2.2. Breakaway Gap
2.3. Measuring Gap
2.4. Exhaustion Gap
2.5. การกำหนดราคาเป้าหมายจาก gaps และข้อควรระวังต่างๆในการใช้ Gaps
1. Indicators
1.1. Trend
-1.1.1. Moving Averages (ทุกประเภท)
-1.1.2. Average Directional Index (ADX)
-1.1.3. Commodity Channel Index (CCI)
-1.1.4. Aroon
-1.1.5. TRIX
-1.1.6. Parabolic SAR
-1.1.7. Force Index
-1.1.8. ZigZag
1.2. Momentum & Oscillators
-1.2.1. MACD
-1.2.2. Relative Strength Index (RSI)
-1.2.3. Rate of Change (ROC)
-1.2.4. Stochastic Oscillator
-1.2.5. Chaikin Oscillator
-1.2.6. Percentage Price Oscillator
-1.2.7. Ultimate Oscillator
-1.2.8. Williams %R
1. Indicators (ภาคต่อ)
1.1. Volatility
-1.1.1. Bollinger Bands, %B and BandWidth
-1.1.2. Average True Range (ATR)
-1.1.3. Keltner Channels
-1.1.4. Standard Deviation
1.2. Volume, Open Interest and Flow of Funds
-1.2.1. Accumulation/Distribution Line
-1.2.2. On Balance Volume (OBV)
-1.2.3. Volume Accumulator
-1.2.4. Chaikin Money Flow (CMF)
-1.2.5. Percentage Volume Oscillator (PVO)
1.3. Market Breadth
-1.3.1. Arms Index (TRIN)
-1.3.2. Advance-Decline Line
-1.3.3. Advance-Decline Volume Line
-1.3.4. Bullish Percent Index
-1.3.5. High-Low Index
-1.3.6. McClellan Oscillator
-1.3.7. McClellan Summation Index
-1.3.8. Net New Highs
-1.3.9. Percent Above Moving Average
-1.3.10. Record High Percent
-1.3.11. Volatility Index (VIX)
1.4. Sentiment indicators and contrary opinion
-1.4.1. Open Interest in Options
-1.4.2. Put/Call Ratios
-1.4.3. Commitments of Traders Report
-1.4.4. Net Trader Positions (Hedgers VS Small Traders)
1.5. อื่นๆ
-1.5.1. Cycle = Detrended Price Oscillator
-1.5.2. Relative Strength = Price Relative
-1.5.3. Comprehensive = Ichimoku Clouds
2. ลักษณะและการใช้งาน Indicators (สอนข้อดีข้อเสียและลักษณะเฉพาะต่างๆของบาง indicators, การนำ indicators ต่างๆมาใช้งานร่วมกัน
2.1. Leading VS Lagging
2.2. Center line & Signal line Crossovers
2.3. Divergences
2.4. Overbought & Oversold
2.5. Trendlines on Indicator
2.6. Indicator on Indicator (เช่น StochRSI)
1. Forecasting Tools
1.1. Fibonacci
1.2. Gann
1.3. Gartley & Butterfly
1. Forecasting Tools (ต่อ)
1.1. Elliott Wave
-1.1.1. Theory (วันที่ 10)
-1.1.2. Application (วันที่ 11)
| จากคุณ |
:
dsc 
|
| เขียนเมื่อ |
:
3 ม.ค. 54 09:53:01
|
|
|
|
 |


