 |
1.
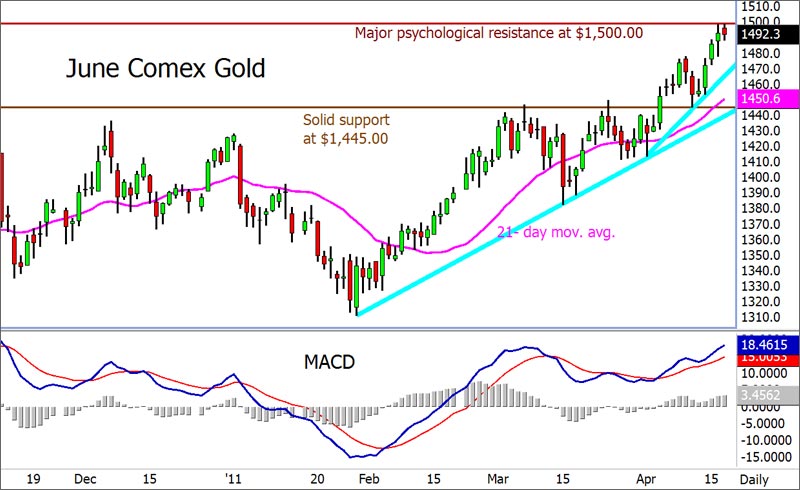
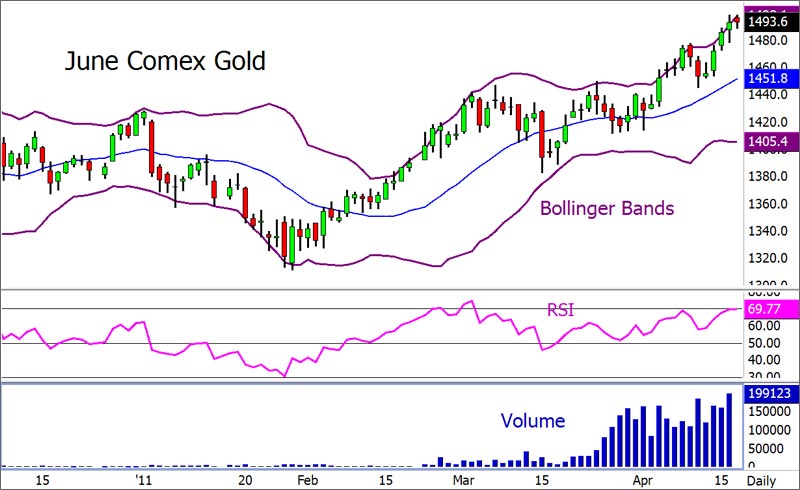
Gold rose to a new all-time high of $1498.05 by about 8AM EST before it fell back off a bit in late morning New York trade, but it then rose to a new high of $1499.40 by midday and ended with a gain of 0.16%. Silver climbed to a new 31-year high of $43.903 in the last minutes of trade and ended with a gain of 2.31%.
Euro gold fell to about €1043, platinum lost $3.50 to $1766.50, and copper gained 3 cents to about $4.22.
Gold and silver equities rose in afternoon trade and ended with over 1% gains.
Oil reversed early losses and ended higher on geopolitical fears as the U.S. dollar index fell after the euro rose on easing debt worries in Europe.
Treasuries saw slight gains on a slow economic growth outlook that kept interest rates low.
The Dow, Nasdaq, and S&P traded mostly slight higher as mixed earnings reports were offset by better than expected housing data.
2.
AUD/USD: Australian Dollar is currently trading at 1.0520 levels. Aud fell for a second day straight against the dollar after RBA reported today in its minutes that the economic growth in Australia is moderate during the first three months of the year. Near term support is seen at 1.0408 levels (21 days EMA) Resistance is seen at 1.0512 levels (4hrly 21 days EMA). Exporters are suggested to book exposure near 1.0500 levels while Importers can cover their exposure near 1.0300 regions. Short Term: Bullish Medium term: Maintain Bullishness.
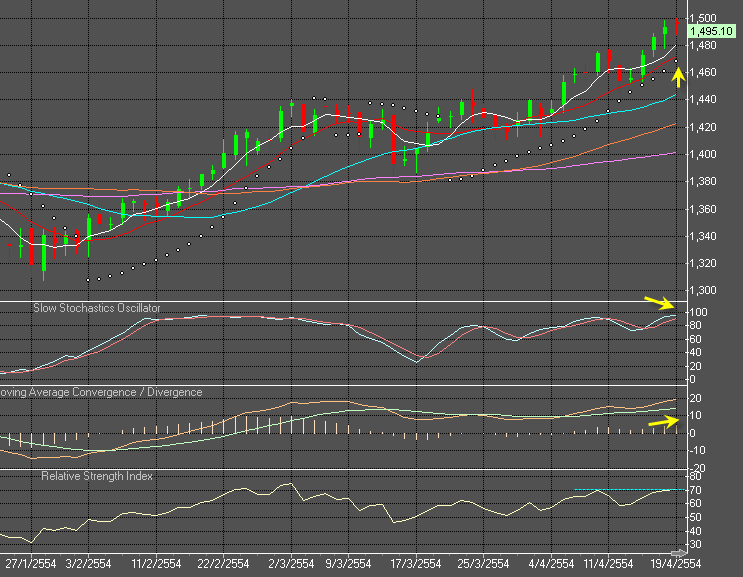
Gold: Gold is trading at 1489.58 levels. Gold gained as Standard & Poor's cut the U.S. long-term credit outlook to negative creating demands for safer heavens. Resistance is seen near 1500 levels while on the downside, buying is expected near support at 1478.89 levels (21 days daily EMA). Gold seems to be in super bull phase. Medium term: Bullish.
Oil: Crude oil is currently trading at $107.34 per barrel . Oil traded low as signs of a worsening economic outlook after Standard & Poor's cut the U.S. long-term credit outlook to negative fueling the speculation that oil demand may falter , but unrest across Middle East nations would still spur oil prices to new highs. Resistance is seen near 108.03 levels (21 days 4 hrly EMA) and Support is seen near 107.13. Short term to Medium term : Maintain Bullishness.
Dollar Index: Dollar Index is trading at 75.13 levels.Support is seen near 75.22 levels (55 days 4hrly EMA)and Resistance is seen near 76.46 (55 days EMA) . Outlook remains bearish for Short Term and Medium Term: Bullish (Post July). interest rate. Immediate resistance is seen near 76.10 levels with psychological support at 75.50levels. Term: Bearish and Medium Term: Bullish (Jun-July).
3.
Gold
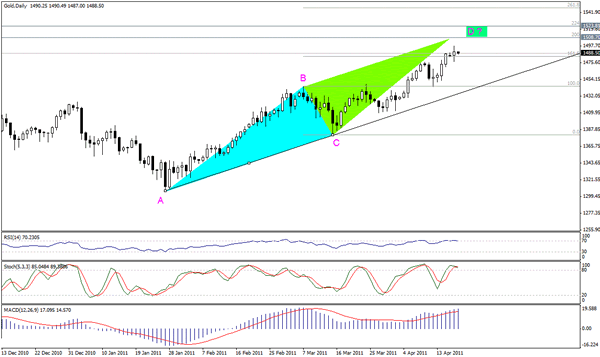
Gold soared towards the first detected technical objective which we expected in the weekly report, accompanied by achieving the technical targets of previous reports published in the previous week. Moreover, it touched 161.8% Fibonacci projection of CD leg of the harmonic butterfly pattern- we recommend reviewing the weekly report for more details-. Now, let us have a deeper look at the bearish harmonic AB=CD pattern, where its BC leg has corrected till 50% of AB. Therefore, we look at 200% or 224% of BC to be the PRZ of the pattern at 1508.00 or 1523.00 zones. Momentum indicators are showing overbought signs but we can't depend on them alone as the four hour closing was achieved above 161.8% of CD leg. To recap, we predicate more bullishness over intraday basis and also during trading of this week.
The trading range for today is among the key support at 1449.00 and key resistance now at 1523.00.
The general trend over the short term basis is to the downside, targeting $ 1208.00 per ounce as far as areas of 1508.00 remain intact.
Support: 1480.00, 1474.00, 1468.00, 1462.00, 1455.00
Resistance: 1490.00, 1494.00, 1500.00, 1508.00, 1523.00
Recommendation Based on the charts and explanations above our opinion is, buying gold around 1485.00 gradually targeting 1500.00 followed by 1523.00 and stop loss with a daily closing below 1468.00 might be appropriate.
| จากคุณ |
:
ฮะ ว่าไงนะ 
|
| เขียนเมื่อ |
:
20 เม.ย. 54 07:24:38
|
|
|
|
 |






 )
)
 (บ้าได้อีก)


 ager.co.th/Around/ViewNews.aspx?NewsID=9540000048795

